Page 10 - THE ROMANIAN HEALTH CARE
P. 10

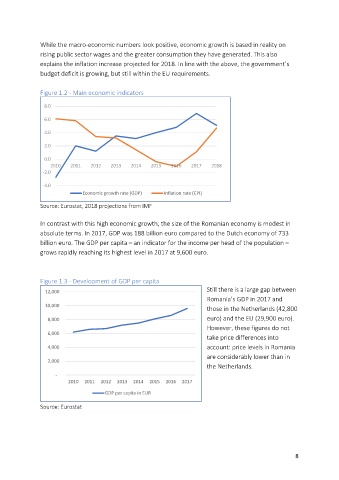
While     the macro-economic numbers look positive, economic growth is based in reality on


               rising     public sector wages and the greater consumption they have generated. This also


               explains     the inflation increase projected for 2018. In line with the above, the government’s


               budget     deficit is growing, but still within the EU requirements.


               Figure     1.2 - Main economic indicators

                 8.0
                 6.0
                 4.0
                 2.0
                 0.0
                   2010     2011     2012     2013     2014     2015     2016     2017     2018
                -2.0
                -4.0


                              Economic     growth rate (GDP)     Inflation     rate (CPI)


               Source:     Eurostat, 2018 projections from IMF


               In     contrast with this high economic growth, the size of the Romanian economy is modest in


               absolute     terms. In 2017, GDP was 188 billion euro compared to the Dutch economy of 733


               billion     euro. The GDP per capita – an indicator for the income per head of the population –


               grows     rapidly reaching its highest level in 2017 at 9,600 euro.


               Figure     1.3 - Development of GDP per capita


                                                                          Still     there is a large gap between

                 12,000


                                                                          Romania’s     GDP in 2017 and
                 10,000

                                                                          those         in the Netherlands (42,800


                  8,000                                                   euro)     and the EU (29,900 euro).


                                                                          However,     these figures do not

                  6,000


                                                                          take     price differences into


                  4,000                                                   account:     price levels in Romania
                                                                          are     considerably lower than in


                  2,000
                                                                          the     Netherlands.
                     -


                         2010    2011  2012  2013  2014  2015  2016  2017


                                      GDP     per capita in EUR

               Source:     Eurostat


                                                                                                         8
   5   6   7   8   9   10   11   12   13   14   15