Page 9 - agri-finance
P. 9

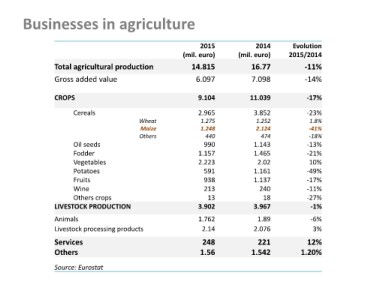
Businesses in agriculture

Total agricultural production         2015         2014     Evolution
Gross added value              (mil. euro)  (mil. euro)    2015/2014

                                  14.815        16.77           -11%

                                   6.097        7.098           -14%

CROPS                          9.104            11.039            -17%

       Cereals        Wheat    2.965              3.852           -23%
                      Maize
       Oil seeds      Others    1.275               1.252           1.8%
       Fodder                   1.248               2.124           -41%
       Vegetables                                                   -18%
       Potatoes                   440                 474
       Fruits                                                     -13%
       Wine                      990              1.143           -21%
       Others crops            1.157              1.465            10%
LIVESTOCK PRODUCTION           2.223                              -49%
                                                   2.02           -17%
Animals                          591              1.161           -11%
Livestock processing products    938              1.137           -27%
                                 213                               -1%
Services                                            240
Others                            13                  18           -6%
                               3.902                                3%
                                                  3.967
                               1.762                             12%
                                2.14               1.89        1.20%
                                                  2.076
                                248
                               1.56                221
                                                1.542

Source: Eurostat
   4   5   6   7   8   9   10   11   12   13   14