
Page 60 - CEE Tax Guide 2025
P. 60
Wage levels in the CEE region
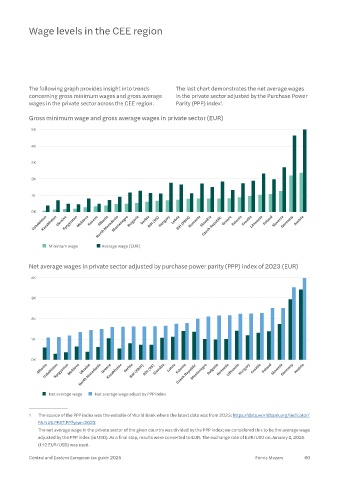
The following graph provides insight into trends The last chart demonstrates the net average wages
concerning gross minimum wages and gross average in the private sector adjusted by the Purchase Power
wages in the private sector across the CEE region. Parity (PPP) index .
1
Gross minimum wage and gross average wages in private sector (EUR)
5K
4K
3K
2K
1K
0K
Uzbekistan Kazakhstan Ukraine Kyrgyzstan Moldova Kosovo North Macedonia Montenegro Bulgaria Serbia BiH (RS) Hungary Latvia BiH (FBiH) Romania Slovakia Greece Estonia Croatia Lithuania Poland Slovenia Germany Austria
Albania
Czech Republic
Minimum wage Avarage wage (EUR)
Net average wages in private sector adjusted by purchase power parity (PPP) index of 2023 (EUR)
4K
3K
2K
1K
0K
Ukraine
Czech Republic
Albania Uzbekistan Kyrgyzstan Moldova North Macedonia Greece Kazakhstan Serbia BiH (FBiH) BiH (RS) Slovakia Latvia Estonia Montenegro Bulgaria Romania Lithuania Hungary Croatia Poland Slovenia Germany Austria
Net avarage wage Net avarage wage adjust by PPP index
1 The source of the PPP index was the website of World Bank where the latest data was from 2023: https://data.worldbank.org/indicator/
PA.NUS.PRVT.PP?year=2023
The net average wage in the private sector of the given country was divided by the PPP index; we considered this to be the average wage
adjusted by the PPP index (in USD). As a final step, results were converted to EUR. The exchange rate of EUR/USD on January 2, 2025
(1.12 EUR/USD) was used.
Central and Eastern European tax guide 2025 Forvis Mazars 60