Page 10 - Economic Outlook Romania 2019
P. 10

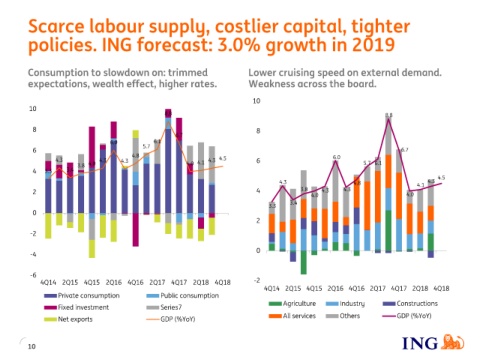
Scarce labour supply, costlier capital, tighter

         policies. ING forecast: 3.0% growth in 2019


         Consumption to slowdown on: trimmed                                Lower cruising speed on external demand.
         expectations, wealth effect, higher rates.                         Weakness across the board.


                                                                             10
          10
                                                  8.8                                                                8.8

           8                                                                  8
                                                      6.7
                                  6.0          6.1
           6                                5.7                                                                          6.7
                                         4.8                                                         6.0
                  4.3          4.3   4.3                 4.0 4.1  4.3  4.5    6
                        3.8  4.0                                                                              5.7 6.1
           4  3.3    3.4
                                                                                                                                    4.5
                                                                                     4.3                   4.8                4.1  4.3
           2                                                                  4            3.8    4.3   4.3
                                                                                              4.0                          4.0
                                                                                        3.4
                                                                                  3.3
           0
                                                                              2

          -2

                                                                              0
          -4


          -6
             4Q14 2Q15 4Q15 2Q16 4Q16 2Q17 4Q17 2Q18 4Q18                    -2
                                                                                4Q14 2Q15 4Q15 2Q16 4Q16 2Q17 4Q17 2Q18 4Q18
                  Private consumption            Public consumption
                                                                                      Agriculture      Industry         Constructions
                  Fixed investment               Series7
                  Net exports                    GDP (%YoY)                           All services     Others           GDP (%YoY)


         10
   5   6   7   8   9   10   11   12   13   14   15