Page 5 - Elderly care and housing demand in the EU
P. 5

The opportunities of ageing

       1.1 More and fitter elderly, but limitations still rise with age


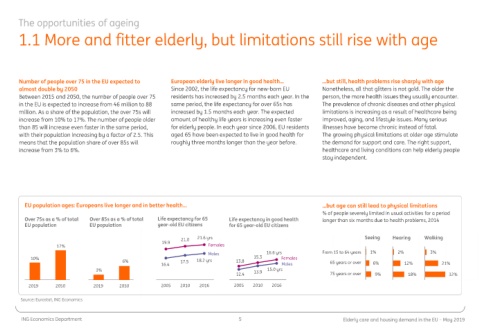
       Number of people over 75 in the EU expected to    European elderly live longer in good health…     …but still, health problems rise sharply with age
       almost double by 2050                             Since 2002, the life expectancy for new-born EU   Nonetheless, all that glitters is not gold. The older the
       Between 2015 and 2050, the number of people over 75   residents has increased by 2.5 months each year. In the   person, the more health issues they usually encounter.
       in the EU is expected to increase from 46 million to 88   same period, the life expectancy for over 65s has   The prevalence of chronic diseases and other physical
       million. As a share of the population, the over 75s will   increased by 1.5 months each year. The expected   limitations is increasing as a result of healthcare being
       increase from 10% to 17%. The number of people older   amount of healthy life years is increasing even faster   improved, aging, and lifestyle issues. Many serious
       than 85 will increase even faster in the same period,   for elderly people. In each year since 2006, EU residents   illnesses have become chronic instead of fatal.
       with their population increasing by a factor of 2.5. This   aged 65 have been expected to live in good health for   The growing physical limitations at older age stimulate
       means that the population share of over 85s will   roughly three months longer than the year before.  the demand for support and care. The right support,
       increase from 3% to 6%.                                                                            healthcare and living conditions can help elderly people
                                                                                                          stay independent.


         EU population ages: Europeans live longer and in better health…                                  …but age can still lead to physical limitations
                                                                                                          % of people severely limited in usual activities for a period
         Over 75s as a % of total   Over 85s as a % of total   Life expectancy for 65   Life expectancy in good health   longer than six months due to health problems, 2014
         EU population        EU population         year-old EU citizens   for 65 year-old EU citizens

                                                                                                                                 Hearing
                                                                                                                                           Walking
                                                                                                                        Seeing
                                                            21.0  21.6 yrs                                             0,0 20,0 40,0      0,0 20,0 40,0
                                                                                                                                0,0 20,0 40,0
                                                      19.9
                   17%                                               Females                                    From 15 to  From 15 to  From 15 to
                                                                                                                         1%
                                                18                   Males              16.6 yrs          From 15 to 64 years  64 years  2% 64 years  3%
                                                                                                                64 years
           10%                                                          18         15.3     Females
                                                                                                                65 years or
                                         6%                 17.5  18.2 yrs    13.8                          65 years or over  65 years or  65 years or  21%
                                                                                                                          6%
                                                                                                                                    12%
                                                13   16.4               13                   Males                over     over      over
                                3%                                                  13.9  15.0 yrs              75 years or  75 years or  75 years or
                                                                              12.4                          75 years or over  9%      18%          32%
                                                 8                       8                                        over     over      over
          2019                2050   2019               2050   2005  2010  2016  2005  2010  2016
        Source: Eurostat, ING Economics
        ING Economics Department                                               5                                 Elderly care and housing demand in the EU – May 2019
   1   2   3   4   5   6   7   8   9   10