
Page 10 - Elderly care and housing demand in the EU
P. 10
Ranking 3: Wealth potential
2.3 Wealth potential highest in the Netherlands and Belgium
Wealth is another important aspect of elderly 74) is wealthier than the older generation (aged 75 and The Netherlands and Belgium have the highest wealth
spending power, which determines to what extent over) in all eleven countries. As a result, we expect a potential for elderly people
seniors can afford care and housing services. rising wealth potential of 75+ people until 2030. The ‘Low Countries’ have the highest elderly wealth
potential. The Netherlands tops the ranking. Dutch
Wealth of ‘older elderly’ people will increase Aftermath of financial crisis still visible financial wealth is substantially higher than in Belgium
We take the wealth of people aged 65 to 74 in 2018 as In four countries, the wealth of elderly people has due to higher (funded) pension accrual.
an estimate for the wealth of people aged 75 and over decreased between 2006 and 2018. In Spain and Italy, Less widespread home ownership make German and
in 2030. Although wealth estimates are very volatile lower house values are an important reason for this Austrian elderly wealth structurally lower relative to the
and therefore hard to forecast, it is plausible that the decline. In addition, these countries have suffered from Western European standard. Moreover, greater
wealth ratio between different age groups in relation to weaker economic growth in this period. inequality lowers median wealth in Germany. There is
each other roughly stays the same. The median wealth of elderly people in the UK was hit still a large gap between wealth in former East and
The younger generation of elderly people (aged 65 to hard by the global financial crisis of 2007/’08, which lead West German regions.
to a prolonged falling of exchange rate and asset prices.
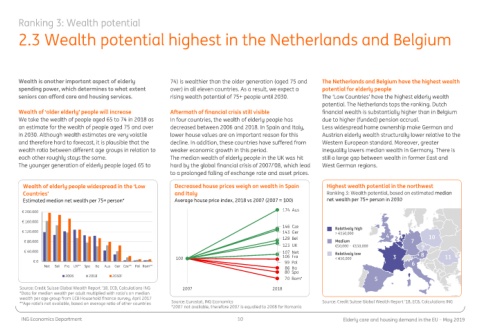
Wealth of elderly people widespread in the ‘Low Decreased house prices weigh on wealth in Spain Highest wealth potential in the northwest
Countries' and Italy Ranking 3: Wealth potential, based on estimated median
Estimated median net wealth per 75+ person* Average house price index, 2018 vs 2007 (2007 = 100) net wealth per 75+ person in 2030
174 Aus
€ 200.000
€ 160.000
146 Cze Relatively high
€ 120.000 143 Ger > €150,000 1
128 Bel 4 2 10
€ 80.000 Medium 7
123 UK €50,000 - €150,000 9
€ 40.000 107 Net Relatively low 8
100 106 Fra < €50,000 3 11
€ 0 99 Pol 6
Net Bel Fra UK** Spa Ita Aus Ger Cze** Pol Rom** 86 Ita
80 Spa
2006 2018 2030F
70 Rom* 5
Source: Credit Suisse Global Wealth Report ’18, ECB, Calculations ING 2007 2018
*Data for median wealth per adult multiplied with ratio’s on median
wealth per age group from ECB Household finance survey, April 2017
Source: Credit Suisse Global Wealth Report ’18, ECB, Calculations ING
**Age ratio’s not available, based on average ratio of other countries Source: Eurostat, ING Economics Source: Credit Suisse Global Wealth Report ’18, ECB, Calculations ING
*2007 not available, therefore 2007 is equalled to 2008 for Romania
ING Economics Department 10 Elderly care and housing demand in the EU – May 2019