
Page 9 - Elderly care and housing demand in the EU
P. 9
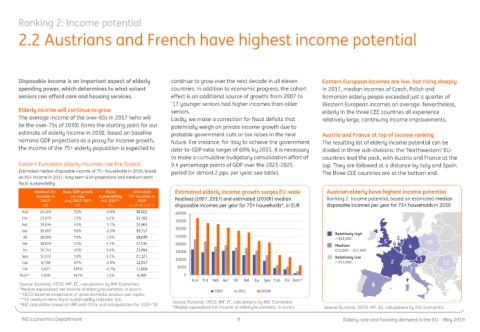
Ranking 2: Income potential

       2.2 Austrians and French have highest income potential


       Disposable income is an important aspect of elderly   continue to grow over the next decade in all eleven   Eastern European incomes are low, but rising sharply
       spending power, which determines to what extent   countries. In addition to economic progress, the cohort   In 2017, median incomes of Czech, Polish and
       seniors can afford care and housing services.     effect is an additional source of growth: from 2007 to   Romanian elderly people exceeded just a quarter of
                                                         ’17 younger seniors had higher incomes than older   Western European incomes on average. Nevertheless,
       Elderly income will continue to grow              seniors.                                         elderly in the three CEE countries all experience
       The average income of the over-65s in 2017 (who will   Lastly, we make a correction for fiscal deficits that   relatively large, continuing income improvements.
       be the over-75s of 2030) forms the starting point for our   potentially weigh on private income growth due to
       estimate of elderly income in 2030. Based on baseline   probable government cuts or tax raises in the near   Austria and France at top of income ranking
       nominal GDP projections as a proxy for income growth,   future. For instance, for Italy to achieve the government   The resulting list of elderly income potential can be
       the income of the 75+ elderly population is expected to   debt-to-GDP ratio target of 60% by 2033, it is necessary   divided in three sub-divisions: the ‘Northwestern’ EU-
                                                         to make a cumulative budgetary consolidation effort of   countries lead the pack, with Austria and France at the
       Eastern European elderly incomes rise the fastest  9.4 percentage points of GDP over the 2021-2025   top. They are followed at a distance by Italy and Spain.
       Estimated median disposable income of 75+ households in 2030, based   period (or almost 2 pps. per year; see table).   The three CEE countries are at the bottom end.
       on 65+ income in 2017, long-term GDP-projections and medium-term
       fiscal sustainability
            Realised 65+   Nom. GDP growth   Fiscal   Estimated   Estimated elderly income growth surges EU-wide  Austrian elderly have highest income potential
             incomes in   per cap.  sustainability  75+ incomes in   Realised (2007, 2017) and estimated (2030F) median   Ranking 2: Income potential, based on estimated median
              2017*   proj. 2017-’30**  ind. (S1)***  2030
               (a)        (b)       (c)    a x (1+b) x (1-c)  disposable incomes per year for 75+ households*, in EUR  disposable incomes per year for 75+ households in 2030
        Aus   24,101     52%       -0.8%     36,922       40000
        Fra   23,079     53%        4.2%     33,762       35000
        Net   19,834     63%       -1.7%     32,963
                                                          30000
        Ger   19,267     56%       -2.0%     30,717                                                           Relatively high
        UK    18,969     53%        1.3%     28,635       25000                                               > €25,000           3
        Bel   18,826     53%        4.3%     27,534       20000                                               Medium          5  6    4     10
        Ita   16,741     45%        9.4%     22,044       15000                                               €15,000 - €25,000          9
        Spa   13,972     59%        5.2%     21,121       10000                                               Relatively low             1
        Cze   6,728      87%       -2.9%     12,917                                                           < €15,000         2                11
        Pol   5,617      105%      -0.7%     11,603        5000                                                                       7
        Rom^  2,628      142%       1.5%      6,269          0
                                                               Aus  Fra  Net  Ger  UK  Bel  Ita  Spa  Cze  Pol Rom^
       Source: Eurostat, OECD, IMF, EC, calculations by ING Economics                                                     8
       *Median equivalised net income of elderly households, in euro’s  2007  2017    2030F
       **OECD baseline projections of gross domestic product per capita,
       ***EC medium-term fiscal sustainability indicator (S1)  Source: Eurostat, OECD, IMF, EC, calculations by ING Economics
       ^ING calculation based on IMF until 2024 and extrapolation for 2025-’30
                                                         *Median equivalised net income of elderly households, in euro’s  Source: Eurostat, OECD, IMF, EC, calculations by ING Economics
        ING Economics Department                                              9                                  Elderly care and housing demand in the EU – May 2019