
Page 8 - Elderly care and housing demand in the EU
P. 8
Ranking 1: Demographic potential
2.1 Spain, Italy and Germany at the demographic top
First we assess the demographic differences between EU country has the largest population of over 75s, until Spain, Italy and Germany rank first in demography
the countries regarding the potential market for 2050, the speed with which the population ages is The country ranking on demographic potential for
elderly care and housing: the population of over 75s. lowest in Germany. elderly care and housing is based on the three
indicators shown in the left graph below, i.e. the
Great differences in degrees of ageing Higher elderly share, more market opportunities projected size (1), proportion (2) and growth (3) of the
In the EU, the most significant ageing of populations A growing proportion of elderly in the population elderly population.
occurs before 2050. There are great differences in how creates growing pressure on the government budget. Spain is the only one of the selected countries that
quick the populations of the eleven countries are This increases the chance of budget cuts on publicly scores above EU average on elderly population growth
ageing: until 2050, the population of over 75s in financed elderly care and housing. People then have to until 2050 as well as on the population share of elderly
Germany will increase by 50%, whereas the Dutch spend more on care and housing themselves. In people in 2050. As a proportion of the total population,
population of over 75s will increase by 100%. general, this increases market opportunities for care Italy will have the largest percentage of elderly people
The ageing of the population is already at an advanced and housing providers. in both 2019 and 2050.
stage in Germany. Although the largest
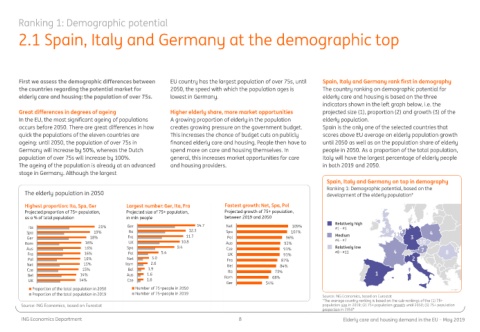
Spain, Italy and Germany on top in demography
Ranking 1: Demographic potential, based on the
The elderly population in 2050 development of the elderly population*
Highest proportion: Ita, Spa, Ger Largest number: Ger, Ita, Fra Fastest growth: Net, Spa, Pol
Projected proportion of 75+ population, Projected size of 75+ population, Projected growth of 75+ population,
as a % of total population in mln people between 2019 and 2050
Ita 21% Ger 14.7 Net 109% Relatively high 8 6
#1 - #3
Spa 19% Ita 12.3 Spa 107% Medium 11 4
Ger 18% Fra 11.7 Pol 96% #4 - #7 3
Rom 16% UK 10.8 Aus 93% 10
Aus 16% Spa 9.4 Cze 91% Relatively low 4 7
Fra 16% Pol 5.4 UK 91% #8 - #11 8
Pol 16% Net 3.0 Fra 87% 2
Net 15% Rom 2.6 Bel 84%
Cze 15% Bel 1.9 Ita 73% 1
Bel 14% Aus 1.6 Rom 68%
UK 14% Cze 1.6 Ger 54%
Proportion of the total population in 2050 Number of 75+people in 2050
Proportion of the total population in 2019 Number of 75+people in 2019 Source: ING Economics, based on Eurostat
*The average country ranking is based on the sub-rankings of the (1) 75+
Source: ING Economics, based on Eurostat population size in 2019; (2) 75+ population growth until 2050; (3) 75+ population
proportion in 2050*
ING Economics Department 8 Elderly care and housing demand in the EU – May 2019