
Page 12 - Elderly care and housing demand in the EU
P. 12
Ranking 4: Care and home support potential
2.5 Belgian and Romanian care and support potential the highest
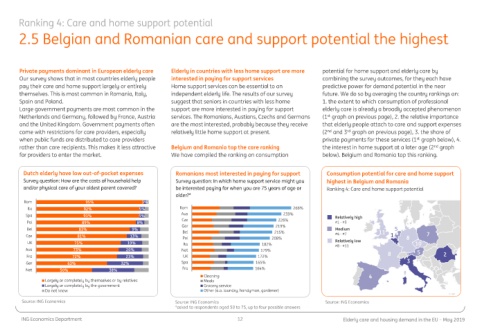
Private payments dominant in European elderly care Elderly in countries with less home support are more potential for home support and elderly care by
Our survey shows that in most countries elderly people interested in paying for support services combining the survey outcomes, for they each have
pay their care and home support largely or entirely Home support services can be essential to an predictive power for demand potential in the near
themselves. This is most common in Romania, Italy, independent elderly life. The results of our survey future. We do so by averaging the country rankings on:
Spain and Poland. suggest that seniors in countries with less home 1. the extent to which consumption of professional
Large government payments are most common in the support are more interested in paying for support elderly care is already a broadly accepted phenomenon
st
Netherlands and Germany, followed by France, Austria services. The Romanians, Austians, Czechs and Germans (1 graph on previous page), 2. the relative importance
and the United Kingdom. Government payments often are the most interested, probably because they receive that elderly people attach to care and support expenses
rd
come with restrictions for care providers, especially relatively little home support at present. (2 nd and 3 graph on previous page), 3. the share of
st
when public funds are distributed to care providers private payments for these services (1 graph below), 4.
rather than care recipients. This makes it less attractive Belgium and Romania top the care ranking the interest in home support at a later age (2 nd graph
for providers to enter the market. We have compiled the ranking on consumption below). Belgium and Romania top this ranking.
Dutch elderly have low out-of-pocket expenses Romanians most interested in paying for support Consumption potential for care and home support
Survey question: How are the costs of household help Survey question: In which home support service might you highest in Belgium and Romania
and/or physical care of your oldest parent covered? be interested paying for when you are 75 years of age or Ranking 4: Care and home support potential
older?*
Rom 95% 3%
Ita 92% 5% Rom 266%
Spa 91% 5% Aus 239% Relatively high
Pol 89% 8% Cze 226% #1 - #3
Bel 83% 9% Ger 219% Medium 5
Bel 215% 11 7
Cze 81% 13% Pol 208% #4 - #7 1 8
UK 75% 19% Ita 182% Relatively low 10
#8 - #11
Aus 73% 20% Net 179% 5
Fra 72% 23% UK 172% 8 2
Ger 63% 32% Spa 165% 3
Net 50% 38% Fra 164%
Cleaning 4
Largely or completely by themselves or by relatives Meals
Largely or completely by the government Grocery service
Do not know Other (a.o. laundry, handyman, gardener)
Source: ING Economics Source: ING Economics Source: ING Economics
*asked to respondents aged 50 to 75, up to four possible answers
ING Economics Department 12 Elderly care and housing demand in the EU – May 2019